
Have you failed to deliver KPIs in the last quarter, month or year? It happens, especially in a challenging and often changing market situation. However, there is a way to get back on track with your business goals! To do so, you need to go through the process of analyzing data, drawing conclusions and making hypotheses to avoid such a situation in the future. Web analytics data will be an invaluable help in this process!
Success in e-commerce is not only a matter of providing attractive products, but also the ability to manage and analyze data. Key Performance Indicators (KPIs) play a fundamental role here, allowing you to assess the effectiveness of your strategy and identify areas for improvement. In this article, we will discuss how to improve the KPIs of an e-commerce site using online data analysis.
Revenue model in E-commerce services
Analyzing data and understanding causes
Using A/B Testing
Useful reports in Google Analytics
Summary
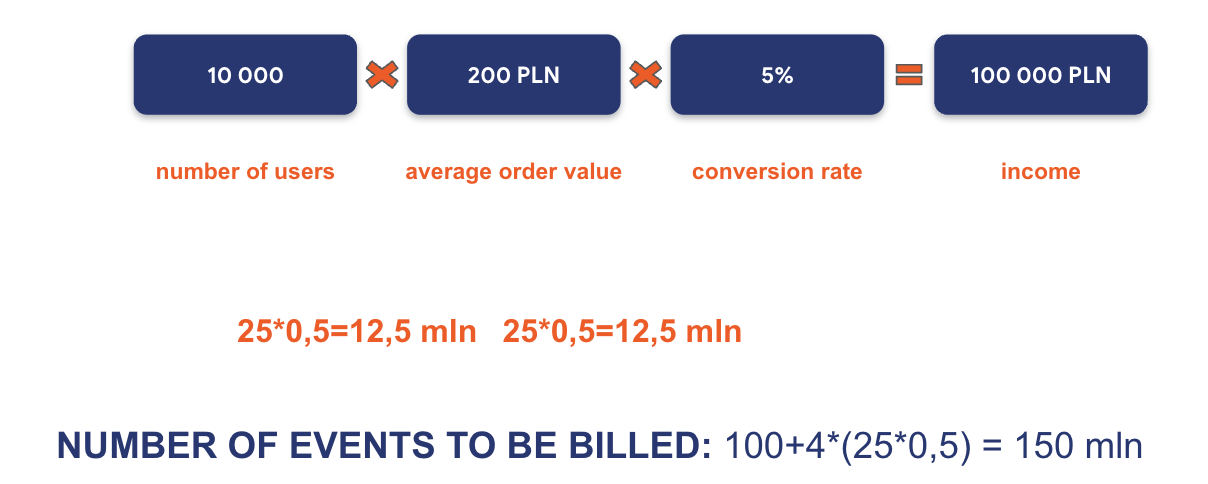
Before we start any data analysis, it’s important to understand what drives our revenue. In e-commerce services, there are 3 main metrics: number of users, average order value and conversion rate.
The revenue that our service generates here is the result of the number of users and the conversion rate (which tells us the number of transactions) and the average order value. By multiplying these values, we get the total revenue of our store.
For example, let’s assume that our store was visited by 10 thousand users per month, generating an average order value of PLN 200, with a conversion rate of 5%. The revenue of the store will be PLN 100 thousand.
This formula, with minor modifications, can be applied not only to e-commerce, but to any service, converting average order value to average customer value over time. Similarly, by defining conversion as the desired action performed by a user on the site, we can study its coefficient and use it for analysis. In this article, however, let’s focus on e-commerce services.
In most cases, in E-commerce services, the main KPI faced by store managers is revenue. While we already know what metrics it consists of, in order to properly analyze the reasons for lower-than-expected revenue, it is necessary to make a deeper decomposition of the component factors. As a reminder – here we will look at the number of users of the service, the average order value and the conversion rate.
The first step is to diagnose which (or which) of these 3 values is at a lower level than we assumed.
In the case of a lower-than-expected number of users, we should take a look at the advertising campaigns being run. Based on the historical data of running campaigns, we can diagnose drops in their effectiveness. Have the current campaigns brought us the same number of users with the same budget? If not, this is a signal to decompose this area and study what is happening to the users targeted by the campaigns.
Important metrics here will be the number of page views and the CTR of each campaign. It may just be that some of them are ineffective, and these are the ones worth working on!
With a lower-than-expected average order value, it’s worth looking at discount policies and up-selling strategies used in the store. Offering the user suggestions in an accessible way for products that match the ones they have already added to their shopping cart can prove to be a hit. It may also be a good idea to introduce promotions and discounts applicable to a specific order value, which should encourage the buyer to increase the value of the shopping cart.
When we get to the point where we determine that the number of users and the average value of their transactions are at the right level, we should look at the conversion rate. This is a very capacious metric, so we should go into it in a bit more detail.
Each user, between entering our site and making a transaction, performs a huge number of intermediate actions. We can call them micro-conversions and arrange them into a kind of purchase funnel. For example – before making the final conversion (purchase), the user first had to reach the check-out. To get there, before that he probably already visited the order summary page, which he got to from the shopping cart, which he went to from the product card, and so on… Namely – the action that we should perform at this stage is the decomposition of the customer’s purchase path (that is, the previously mentioned funnel) and its in-depth analysis.
It is good practice to start this analysis “from the end”. So let’s start with the check-out of our service. To standardize, if the check-out closing ratio (understood as the ratio of the number of transactions to the number of users/sessions in the shopping cart) is below 40%, this is definitely an area in need of improvement. If it is above 70%, we can safely conclude that everything is fine at this stage of the customer path.
The next step should be to look at the ratio of users in the shopping cart to those who reached the product card. Here it is worthwhile to refer to historical campaign data and see what actions on the product card are performed by users who did not go to the shopping cart. This will allow us to diagnose what changed their decision. It may also turn out that users acquired from current campaigns have a visibly higher rate of this particular micro-conversion. This may be an indication of their inadequate customization.
In analyzing the customer path, it is worth going into as much detail as possible to effectively diagnose problems. On each subpage visited during the buying process, we can decompose separate funnels of this kind. For example, when filling out a form with personal information, it is worth looking at at which stage (after interacting with which field) the largest portion of users drop out.
A meticulous analysis will help us diagnose the problem areas on our site. But… what’s next?
The first step of conducting an analysis based on online data is already behind us. But how to use the information gained from it? After mapping the areas for improvement, it’s time to make hypotheses about what should be done or changed to improve conversion rates at different stages of the funnel.
Once the hypotheses are set, it’s time to verify them. This is where A/B testing comes to our aid. Let’s assume that in the course of analysis we noticed that in some of the campaigns we run the creatives have changed. Coincidentally, there was also a decrease in the engagement of users who were on the product card. So the negative impact of the creative change here will be a hypothesis that we will verify.
It is A/B testing that we will use to verify this hypothesis. We will display both version A (the original) and version B (which has changes in the creation resulting from the hypothesis we are analyzing) to the recipients we are targeting with our ads. Over the course of the test, with two variants of the ad creation, one of them will go to one half of the users, and the alternative to the other. Similarly, when the tested creatives will be more. With the data from these campaigns, we will be able to determine which of the creatives results in higher audience engagement – that is, the rate of transition from the product card to further stages of the purchase process. Ultimately, this will allow us to assess the validity of our hypothesis.
If the question popped into your head whether the changes in the campaign resulting from the hypothesis can’t simply be implemented to it and compare the results of the next period with the previous one – not the best idea. We need to keep in mind that campaigns are also affected by external factors, which can differ significantly from period to period. These factors include, for example: the economic climate, the actions of competitors, seasonality, etc. The obvious conclusion, then, is that A/B testing will give us the most reliable information when verifying our hypotheses.
When looking for the causes of under-reported KPIs in the data in Google Analytics, it is much easier to find them when we have a clearly defined problem. A completely different, but also very important topic, is analyzing data when the results are at the right level. Often there is then no clear motivation to work with the data, although there are always smaller or larger areas for improvement. It’s a good idea to start by monitoring the 3 reports described below, which definitely make it easier to analyze online data in E-commerce on a regular basis.
The first report we recommend is the funnel report, which will show us at what stages, after hitting the product card, users do not make further conversions. In e-commerce services it is worth paying special attention to the tightness of the checkout – if we note a value below 40% there is probably room for improvement.
To get to the report in Google Analytics 4, go to reports -> revenue generation -> path to purchase (the name may vary, depending on when the report appeared and when we set up the account). Compared to UA, in GA4 we have an important change – this report shows the flow of users who went through the next stage of the funnel, rather than the number of events (i.e., the number of additions to cart vs. start of checkout vs. purchase). We can analyze the funnel per device category, country, region, city, language and browser as standard.
The second valuable report is the landing page report. Thanks to it, we will learn how users get to the site, as well as check at what level the engagement rate on specific subpages of the site is (the inverse of the rejection rate). In a situation where the mentioned coefficient is not at the right level, it is worth working on the consistency of the advertising creation with what we present on the product card.
To get to the landing page report, go to reports -> engagement -> landing page. This is one of the newest reports to appear in Google Analytics 4. If you don’t see the report here, it should be available in the library, from which you can add it to a set of reports anywhere you choose. The report differs strongly from the one available in UA, which was basically a copy of the source/medium report. In the case of the report in GA4, we have information about all users (including new users) who started a session from a particular subpage of the site or app screen. What’s missing, however, is information on rejections or engagement and the number of subsites per session, which was available in the UA report. However, nothing prevents you from adding such data by editing the report using the pencil icon available in the upper right corner. When analyzing, it is worth paying attention to the “Conversions” column and marking only those conversion events that you want to analyze.
The third valuable report in Google Analytics is the report of the site’s effectiveness towards technology (e.g. browser or screen resolution). Sometimes at the development stage of a website, important technical elements are overlooked. This could be, for example, a call to action button placed under a page wrap, or a service element not displaying correctly in a particular browser or its version.
To access the site’s effectiveness report against technology, go to reports -> technology -> technology related details. This report will show us potential issues related to the devices and browsers the user is using.
When analyzing the web version, it is worth paying special attention to such dimensions as browser, device category, screen resolution and device make or model. It is worth remembering that in the case of Apple-branded devices, we will get very limited information about the device itself. In the case of browsers – it’s worth looking at the report more closely if any of them has recently rolled out an update (this can cause problems with the operation of our site, especially in the case of Firefox and stores on PrestaShop). New is an additional device category, smart tv, which includes TVs with built-in browsers, as well as gaming consoles such as PlayStation and Xbox.
When analyzing traffic from an app, be sure to check the version users are using – an outdated app can generate errors. Also take a peek at the Overview report in the Technology folder – there you will find additional information about the app’s stability and potential bugs in its operation.
Monitoring the previously mentioned reports will be a good start to conducting regular analysis of the site. It is also a good practice to pay special attention to the pages that generate the most traffic. When running E-commerce advertising campaigns, these will mostly be product cards. We should also pay attention to the check-out page from our store, where we can often easily diagnose a simple-to-solve problem affecting a low conversion rate. Let’s not fool ourselves – when a user reaches the very end of the purchase path, it means that he is determined to buy, and a low conversion rate at the last stage of the funnel is a clear signal that we should improve something here.
In conclusion – improving KPIs in e-commerce requires conducting meticulous data analysis and focusing on key components: number of users, average order value and conversion rate. Once the problematic component affecting revenue has been diagnosed, it should be decomposed as accurately as possible, hypotheses should be set and testing should begin. Using A/B testing to verify hypotheses and considering external factors are key aspects on the road to success.


Tags:
Success stories
Ostatnie wpisy na blogu