

Have you ever faced a scenario when your Google Analytics showed data that differed from those collected by other tools? If so, you have surely wondered whether this is a normal situation and whether you should be concerned about it. To answer these questions, it’s helpful to first know what level of data discrepancy between tools you should expect – that is, what we can consider as standard or acceptable. A key step will also be to determine what we are comparing our data to, i.e. what we consider to be our first source of truth. But one step at a time…
The first source of truth – a reference point
Data presentation in Google Analytics
Data in Google Analytics vs. RODO
What level of data discrepancy is acceptable?
How to check the level of data discrepancy in a service?
Data discrepancies depending on the type of service
Google vs. other advertising systems/a>
How to reduce data discrepancies with changes in transaction recording
Summary
At Conversion, we most often work with e-commerce services, and as a result, the main point of reference in the projects we carry out is the warehouse and accounting system. It is the one that most often provides the previously mentioned first source of truth, relative to which we compare other data such as the number of transactions or revenue from those transactions.
When we talk about comparing data from Google Analytics to that from a company’s internal system (transactional system or CRM), we need to be aware that we are talking about two areas of data comparison – relevance and accuracy. Let’s start by clarifying these two key terms.
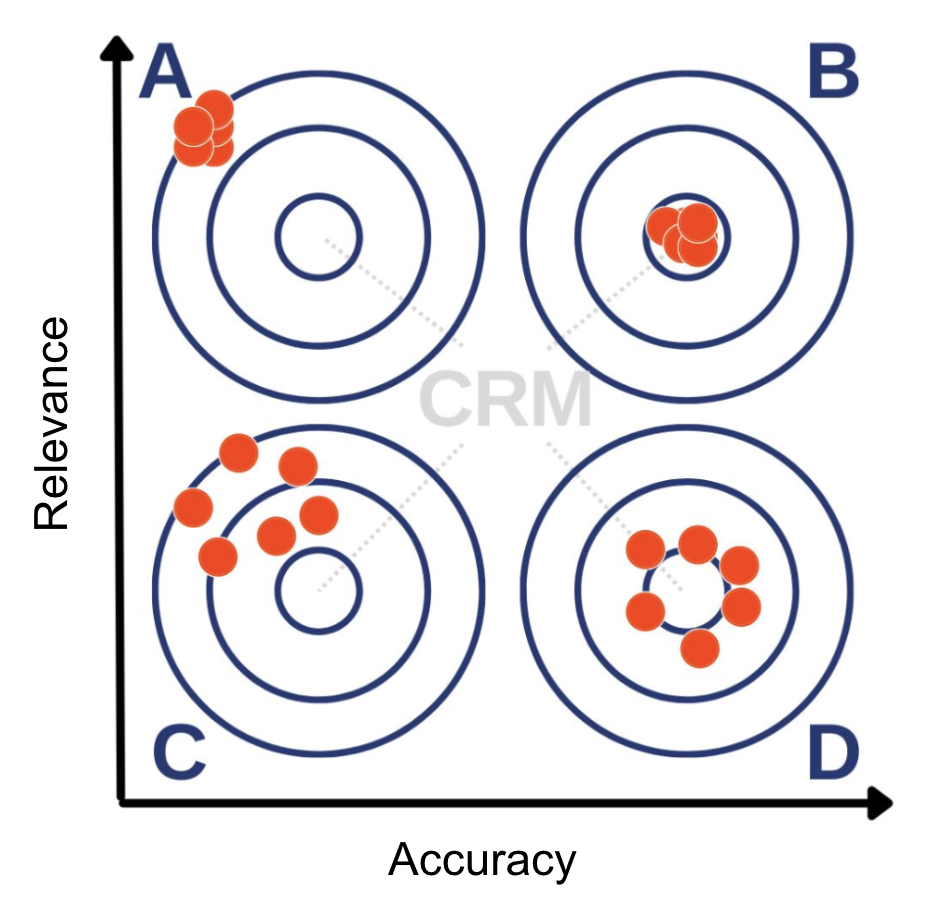
Relevance vs accuracy in Google Analytics
We talk about relevance when some external tool (here Google Analytics) shows exactly the same data that we see in our reference point. For the purposes of this article, let’s assume that in ecommerc’s case it is a CRM system. For example, we can find data on orders placed in our store. If Google Analytics collects data characterized by accuracy, the number of transactions will be equal to that in the internal system.
When examining the accuracy of the collected data, we no longer pay attention to the exact representation of the data in quantitative terms. Here, trends are a much more important element. If the number of transactions in our CRM is growing at a given rate during the period under study, this should also be reflected in our Google Analytics.
Google Analytics collects – and consequently – presents data based on a couple of foundations. The first of these is JavaScript, which is embedded in the site’s source code or inserted into the page using Google Tag Manager. It is triggered when the page is loaded. Its task is to create and read cookies, which contain a unique user ID within them. In this case, we say that Google Analytics operates on the basis of JavaScript. However, not all visitors to our site have JavaScript or cookies enabled. Users also often use plug-ins that intentionally block not only ads, but also Google Analytics scripts. In such a situation, the actions performed by the user will not be tracked.
Now let’s return to the concept of accuracy. As we mentioned before, the main function of Google Analytics as a tool of the Digital Analytics class is not to show exactly the same data as the internal system. Its main purpose is to link the source of a user’s traffic (the place from which they came to the site) with their behavior on the site once they got there. It gives website managers the information they need to assess how, depending on the traffic source and behavior on the site, the user performs the actions they want – that is, they make conversions. So we need to remember that web analytics tools exist to answer questions about how to achieve the goals we have set for our site, not to collect 100% accurate data. This, unfortunately, is not possible due to the blocking of some of the information shared by users.
We live in an era of increasing concern for user privacy (GDPR). For some time now, website owners have had to take a proactive approach to obtaining user consents for the creation and use of cookies. It is obvious, then, that the more users accessing our service do not give this consent, the greater the discrepancies in the data will be. For this reason, Google Analytics will never reflect 1-to-1 the data that is collected in the internal system. That’s why it’s so important to study the trends we observe in CRM and compare them with those noted in Google Analytics 4.
Often, when working with clients, it happens that when we don’t have 100% of transactions recorded in Google Analytics, they are “sent” to it, e.g. via measurement protocol. This is not an appropriate approach to the subject of data discrepancies, for the reason that was mentioned earlier – Analytics is used to evaluate the effectiveness of traffic according to its sources or site behavior – not to collect fully complete data. If we “send” transaction data from CRM to Analytics, which it did not record due to the user’s cookie blocking, we will not have information about the related traffic source or user behavior on the site. As a result, we will not be able to take a closer look at the transaction and will not get valuable information about it.
So let’s keep in mind when using web analytics tools about their main function and not require them to be fully accurate and relevant – such a situation does not happen in real life.
Having reached this point in the article, you’re bound to wonder what level of discrepancy you shouldn’t be concerned about. Let’s assume that the data you see in Google Analytics is characterized by accuracy – the trends correspond to those seen in the CRM system. So let’s consider what level of accuracy we can consider appropriate.
In the projects we carry out, we aim for a level of data convergence in Google Analytics with internal systems of 85%. This means that for every 100 transactions recorded in the CRM system (the actual number of transactions on the site), an average of 85 should be reflected in the data in Google Analytics.
Thankfully, there is a simple way to do this on ecommerce sites. In the internal transaction system (the first source of truth), we have data on all transactions made on the service, along with the ID assigned to the users making them. With Google Analytics configured correctly, we will see the same transactions in it, with the same assigned ID.
So the simplest thing to do is to export the data from the internal system and compare it with the data available in Google Analytics, and then see how many IDs from the CRM system are missing in Analytics.
In order to make the most valuable comparison, it is also important to pay attention to the characteristics of users, by which we can segment the completed transactions visible in CRM and invisible in Google Analytics. This will provide additional hypotheses about what the discrepancies between the systems might be due to – and that’s the first step to reducing them.
We mentioned before that in most cases 85% data convergence is the level we should strive for. After delving more deeply into the subject, however, the answer is not so zero-one. A satisfying level of divergence also depends on the type of service – or, to be more precise, on the characteristics of the service’s users.
We have to realize that, as marketers, we are characterized, in general, by a higher level of awareness of Internet use. However, this does not mean that “ordinary” users are homogeneous in this respect. This is also reflected in the level of discrepancy in the data.
On websites that collect more aware users, they are more likely to have disabled browser functionalities on which Google Analytics collects data, such as JavaScripts and cookies. They can also block the transmission of information about themselves to the tool with special add-ons, blocking not only ads, but also tracking of their online activities by Google Analytics. For such sites, the level of data convergence will be noticeably lower. This is mainly the case with specialized sites, especially in the IT industry, where the level of convergence will reach “only” 40-50%.
On the other hand, for websites visited by moderately less informed Internet users, such as clothing or electronics stores, we can expect a data convergence level of 85% or higher, as mentioned before.
Discrepancies between internal systems and Google Analytics, is not the only challenge analysts face. Differences in data will also be noticeable between different advertising systems (assigned to different online marketing tools) and Google Analytics 4. This is despite the fact that these tools are based on the same JavaScript technology. So why does this happen? We should look for the answer in the attribution model used.
As an example, let’s take Facebook’s advertising system, Facebook Ads. It will strive to show the highest possible number of conversions made through ads in this system in order to attract advertisers who are encouraged by the results. On the other hand, Google Analytics receiving this data no longer has such an interest. So we can assume that the data in Google Analytics 4 should be more objective.
To illustrate this sort of war of giants between companies, let’s take a look at ads in Facebook’s mobile app. Like most users, we probably have an in-app browser installed on our phones, running on what is known as WebView. In this case, when we switch from Facebook to a third-party service, it is not displayed in the new browser, as a result of which access to data from the Google Analytics perspective is blocked. This is why the data available in Facebook’s advertising system will notice and note this action – unlike Analytics. As a result of this action, as advertisers we are encouraged to use the data in Meta’s advertising system – because that is where we will see the data.
When analyzing the data, we need to keep these nuances in mind and choose the most appropriate (reliable) attribution model for us, and it is this model that will guide us in further analysis. Each of them has its advantages and disadvantages, so it is the decision on how we want to analyze the data that is crucial – after all, we don’t want to end up in a situation where the number of conversions coming from the advertising systems used is several times higher than the actual number of transactions visible in the CRM system.
One of the most common problems in the field of ecommerce data discrepancies are those related to transaction registration. These arise when using third-party payment gateways. In this case, transactions are registered by default when the user returns to the site. However, users very often do not return to the service after making a payment, which causes a lot of discrepancies….
How to deal with this? We recommend counting transactions in Google Analytics just before going to the external payment itself. Our observations show that there is a much higher probability that a user will not return to the service after making a payment, than that he or she will go to make a payment and abandon it immediately afterwards. This is caused by two things:
Because of this, in order to mitigate data discrepancies, we recommend setting up conversion counts just before going to the payment gateway.
When using web analytics tools, let’s remember what their purpose is and not treat them as the only source of truth. The data collected by such tools should be characterized by accuracy (not relevance) and this is what we should strive for, and a satisfactory level of convergence in most cases is 85%. However, depending on the type of service, this will not always be possible, and we should keep this in mind as well. In analysis, let’s pay more attention to the consistency of trends between Google Analytics and CRM, rather than accurately reflecting the number of transactions. In this way, informed analysis will lead us to more valuable conclusions!


Tags:
Success stories
Ostatnie wpisy na blogu